Hi - we have purchased and currently use your Word and Powerpoint products for Java. We are evaluating Cells for java and i have a question for you about custom charts. I need to be able to create many different types of charts depending on the data. One in particular is a Line Chart with the default ‘laypout 9’ features. In excel, If you chose line chart, click the design tab, and then chose layout 9 - that is the exact format that I need to create. Is there a way to choose that layout? Or is there a way to load that template and use it? I have nn excel file with the chart that I need. Can I upload this file to you? Thanks
Thanks for considering Aspose APIs.
Aspose.Cells can create almost all of charts and their sub-parts like gridlines, legends, axis etc. However, it does not work well, when there are predefined layouts. We are afraid, you will have to create layout yourself from scratch using Aspose.Cells.
As a workaround, we recommend you to create your chart in Microsoft Excel and then change the values of the series.
Please see the following sample code, its template Excel file as well as the output Pdfs created by it to get started.
The sample code changes the values of the cell A2, A3, A4 etc. and after changing the value of each cell, it takes its output Pdf.
Download Link:
template excel file output pdfs.zip (97.5 KB)
Java
//Load your template containing chart
Workbook wb = new Workbook(dirPath + "template.xlsx");

//Access first worksheet
Worksheet ws = wb.getWorksheets().get(0);

//Access first chart
Chart ch = ws.getCharts().get(0);

//Change the values of the cells and take their pdfs
for (int i = 2; i <= 6; i++)
{
	//Access the cell
	Cell cell = ws.getCells().get("A" + i);

	//Get its old value
	int oldVal = cell.getIntValue();

	//Change its value to 200
	cell.putValue(200);

	//Takes its pdf
	wb.save(dirPath + "out-" + cell.getName() + ".pdf");

	//Restore the old value
	cell.putValue(oldVal);
}
Download Links In Parts:
CreateRequiredChart.part1.rar.zip (2 MB)
CreateRequiredChart.part2.rar.zip (1.1 MB)
Ok – thanks. That is good information. But it is not exactly what I am looking for. I need to create all of this programmatically if possible. I am going to have 10-12 charts for my users to choose from and I am then extracting the image chart out to display in a jsp UI.
So – back to your statement “you will have to create layout yourself from scratch using Aspose.Cells.” can you help me out there. What are the API objects and features that I need to look into? I have attached an excel file with a chart that I like to create. It is a pretty simple line chart but I chose it from an existing layout in Excel.
Basic things I would need to do for a line chart…
- Change the color of the lines
- Add values of each point on each line
- As you say – add grid lines, legends etc.
But in general I am going to need to create all kinds of charts in Excel and being able to modify them in java code is the key.
Thanks
–John
LineChartLayout9.zip (8.9 KB)
Your chart is definitely creatable from scratch and you can create all of it programmatically using Aspose.Cells APIs.
We will create all of it or some part of it and share sample code with you asap.
ok thank you very much. One question for you that I hit on briefly. Our current product allows users to upload MS-Word docs into our system . These docs have mail merge tags that we use to dynamically display data and create a new word doc that they basically created and formatted how they wanted. We do the same thing for power ppint - but we use the ‘alt-text’ value instead of the mail merge values. So - the big requirement that I am looking to fulfill is to give our users the ability to create a chart in excel, save that design as a crtx template file, upload that into our system, and then use that to display the graphic in a web page (or any other format like word or ppt). So - have you all tried to incorporate using the crtx templatess in Excel? I have read that you had not success but it might be in a later release. What is the status? It would be ideal if we could use crtx files. Thanks
Please share your crtx file containing your chart so that we could look into it further. Please also wait that we share the sample code of the line chart as discussed previously. It may clarify Aspose.Cells strength and limitations for your existing requirements. However, you can take the chart images and display on your website.
Thanks for considering Aspose APIs.
Please download the Microsoft Visual Studio 2015 - Sample Console Application Project that generates your needed chart as well as the Output Excel file generated by the project for a reference.
Download Links:
Microsoft Visual 2015 Sample Console Application Project
Output Excel file generated by Aspose.Cells.zip (11.6 KB)
sc.png (73.6 KB)
How Chart was Created?
We loaded your chart and checked its values in Debug and Quick Watch windows and created replica of it. Now, you should do the same to make changes inside it.
First create your chart in Microsoft Excel and do whatever changes you need to do and then load your chart with Aspose.Cells and check various properties in Debug or Quick Watch windows and you will then be able to create replica of it.
Please read all the comments inside the code for more help.
C#
//Load your workbook containing your chart
Workbook wb = new Workbook("LineChartLayout9.xlsx");

//Access first worksheet
Worksheet ws = wb.Worksheets[0];

//-------------------------------
//-------------------------------
//Now we will check different values of your existing chart in Debug and Quick Watch
//to create its replica using Aspose.Cells
//-------------------------------
//-------------------------------

//Access your existing chart and calculate it.
Chart c = ws.Charts[0];
c.Calculate();

//Create a Line Stacked chart
int idx = ws.Charts.Add(ChartType.LineStacked, 28, 1, 48, 12);

//Access the new chart
Chart ch = ws.Charts[idx];

//Set its Title, Title Font and Size
ch.Title.Text = "Sample Chart";
ch.Title.Font.Name = "Calibri";
ch.Title.Font.Size = 18;

//Set the Plot Area background color white
ch.PlotArea.Area.ForegroundColor = Color.White;

//Add three series as per your chart
ch.NSeries.Add("A2:A9", true);
ch.NSeries.Add("B2:B9", true);
ch.NSeries.Add("C2:C9", true);

//Set the category data as per your chart
ch.NSeries.CategoryData = "d2:d9";

//Access the first series and set its name
//set its data label postion and show values
//set its line weight
Series a29 = ch.NSeries[0];
a29.Name = "=A1";
a29.DataLabels.Position = LabelPositionType.Right;
a29.DataLabels.ShowValue = true;
a29.Border.Weight = WeightType.WideLine;
a29.Border.WeightPt = 5.25;

//Access the second series and set its name
//set its data label postion and show values
//set its line weight
Series b29 = ch.NSeries[1];
b29.Name = "=B1";
b29.DataLabels.Position = LabelPositionType.Right;
b29.DataLabels.ShowValue = true;
b29.Border.Weight = WeightType.WideLine;
b29.Border.WeightPt = 5.25;

//Access the third series and set its name
//set its data label postion and show values
//set its line weight
Series c29 = ch.NSeries[2];
c29.Name = "=C1";
c29.DataLabels.Position = LabelPositionType.Right;
c29.DataLabels.ShowValue = true;
c29.Border.Weight = WeightType.WideLine;
c29.Border.WeightPt = 5.25;

//Save the output excel file
wb.Save("output.xlsx");
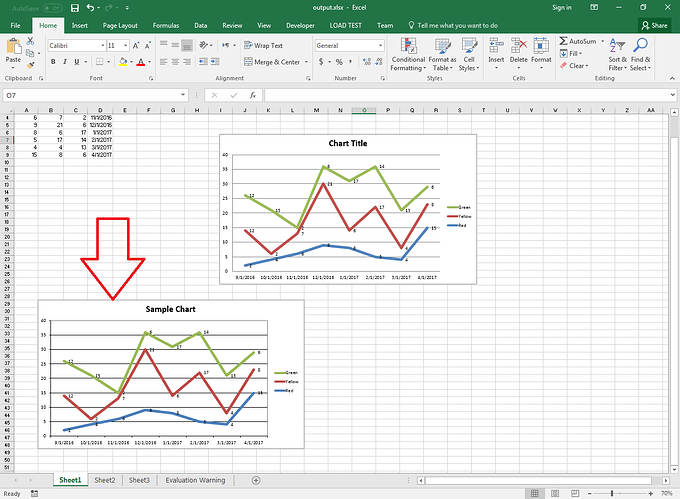
Screenshot
The screenshot shows the output Excel file. It shows, the replica of your chart has been created by Aspose.Cells programmatically.
Ok - here is the template file that I saved from the chart in the previous excel file that I uploaded…LineChartLayout9Template.zip (4.8 KB)
This looks great - but I am using Java - not c#.
Can you help me out with the Java API?
Sure, we will provide you equivalent Java code and look into your crtx file and update you asap.
Here is the Java code for your reference. It works fine as I have tested it.
Java
//Load your workbook containing your chart
Workbook wb = new Workbook(dirPath + "LineChartLayout9.xlsx");

//Access first worksheet
Worksheet ws = wb.getWorksheets().get(0);

//-------------------------------
//-------------------------------
//Now we will check different values of your existing chart in Debug and Quick Watch
//to create its replica using Aspose.Cells
//-------------------------------
//-------------------------------

//Access your existing chart and calculate it.
Chart c = ws.getCharts().get(0);
c.calculate();

//Create a Line Stacked chart
int idx = ws.getCharts().add(ChartType.LINE_STACKED, 28, 1, 48, 12);

//Access the new chart
Chart ch = ws.getCharts().get(idx);

//Set its Title, Title Font and Size
ch.getTitle().setText("Sample Chart");
ch.getTitle().getFont().setName("Calibri");
ch.getTitle().getFont().setSize(18);

//Set the Plot Area background color white
ch.getPlotArea().getArea().setForegroundColor(com.aspose.cells.Color.getWhite());

//Add three series as per your chart
ch.getNSeries().add("A2:A9", true);
ch.getNSeries().add("B2:B9", true);
ch.getNSeries().add("C2:C9", true);

//Set the category data as per your chart
ch.getNSeries().setCategoryData("d2:d9");

//Access the first series and set its name
//set its data label postion and show values
//set its line weight
Series a29 = ch.getNSeries().get(0);
a29.setName("=A1");
a29.getDataLabels().setPosition(LabelPositionType.RIGHT);
a29.getDataLabels().setShowValue(true);
a29.getBorder().setWeight(WeightType.WIDE_LINE);
a29.getBorder().setWeightPt(5.25);

//Access the second series and set its name
//set its data label postion and show values
//set its line weight
Series b29 = ch.getNSeries().get(1);
b29.setName("=B1");
b29.getDataLabels().setPosition(LabelPositionType.RIGHT);
b29.getDataLabels().setShowValue(true);
b29.getBorder().setWeight(WeightType.WIDE_LINE);
b29.getBorder().setWeightPt(5.25);

//Access the third series and set its name
//set its data label postion and show values
//set its line weight
Series c29 = ch.getNSeries().get(2);
c29.setName("=C1");
c29.getDataLabels().setPosition(LabelPositionType.RIGHT);
c29.getDataLabels().setShowValue(true);
c29.getBorder().setWeight(WeightType.WIDE_LINE);
c29.getBorder().setWeightPt(5.25);

//Save the output excel file
wb.save(dirPath + "output.xlsx");Ok - that is certainly a work around - but my ultimate goal is that I need to create all of this programmatically. I am going to have 10-12 charts for my users to choose from and I am then extracting the image chart out to display in a jsp UI.
So – back to your statement “you will have to create layout yourself from scratch using Aspose.Cells.” can you help me out there. What are the API objects and features that I need to look into? I have attached an excel file with a chart that I like to create. It is a pretty simple line chart but I chose it from an existing layout in Excel.
Basic things I would need to do for a line chart…
Change the color of the lines
Add values of each point on each line
As you say – add grid lines, legends etc.
But in general I am going to need to create all kinds of charts in Excel and being able to modify them in java code is the key.
Thanks
–John
We suggest you to first create your chart manually using Microsoft Excel and then load your Excel file in Workbook object and inspect various properties of the Chart and then create replica of it.
Please note, .NET and Java APIs are 100% same. I have given you code in C# and Java and if you read the code, you find, the code is exactly same.
The only difference is that C# property Title will become getTitle() and setTitle(), only get and set words are added in Java.
Once, you created your chart and you get familiar with the API, then we are pretty sure, you will be able to create your chart dynamically and easily, all of it and its part programmatically.
Here are online API references for Chart. One is .NET link and other is Java link
Ok - that sounds like a plan. One question - what do you mean by "inspect various properties of the Chart " How would I do that?
and - one other question that I came across. I need to display data over time - but I only have a start date and an end date. Do you have API calls that will help with that? I also need to display that data over time with different divisions in the time frame - for example i might need to divide the time into months, maybe days, maybe years.
Please first try the code and execute it and it will answer your many questions. It will also give you an idea what benefits you get with Aspose.Cells and what are its limitations.
Inspecting various properties mean that you first create your chart in Microsoft Excel and then load your workbook and access your chart and check its properties which give you an idea how to do it via code.
Suppose, you create a chart manually using Microsoft Excel in a file named abc.xlsx. The following code checks the title text of your chart. Similarly, you can check other properties.
Java
Workbook wb = new Workbook("abc.xlsx")
Worksheet ws = wb.getWorksheets().get(0);
Chart ch = ws.getCharts().get(0);

//Check its title
System.out.println(ch.getTitle().getText());