How to shift x axis and y axis line inside chart in case of negative values on series. Aspose.word.dll for .net
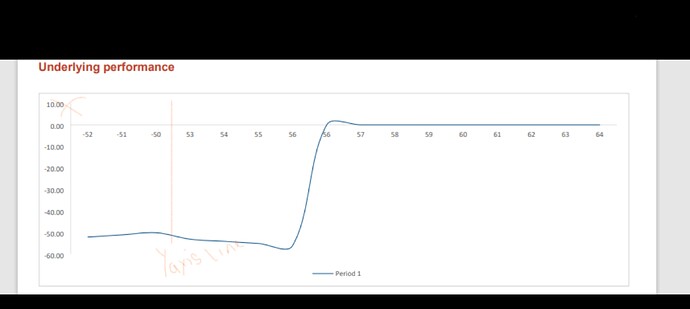
Attaching sample image
How to shift x axis and y axis line inside chart in case of negative values on series. Aspose.word.dll for .net
Attaching sample image
To customize the chart in Word and shift the x-axis and y-axis lines inside the chart in the case of negative values on the series, you can use the Aspose.Words for .NET library. Here are the steps and code snippets to help you accomplish this task:
Load Your Word Document: First, you need to load your Word document into Aspose.Words.
Access the Chart: Locate the chart you want to customize in the document.
Set Axis Properties: Modify the properties of the x-axis and y-axis to shift them inside the chart area, especially when dealing with negative values.
Below is a sample code snippet that demonstrates how to accomplish the task:
using System;
using Aspose.Words;
using Aspose.WordsDrawing.Charts;

namespace ShiftAxisInsideChart
{
    class Program
    {
        static void Main(string[] args)
        {
            // Load the Word document
            Document doc = new Document("SampleDocument.docx");

            // Access the first chart in the document
            Chart chart = (Chart)doc.GetChild(NodeType.Shape, 0, true).GetShapeRenderer().GetChart();

            // Access the x-axis and y-axis of the chart
            Axis xAxis = chart.Axes.HorizontalAxis;
            Axis yAxis = chart.Axes.VerticalAxis;

            // Shift the x-axis and y-axis inside the chart area
            xAxis.MajorGridlines.Format.Fill.ForeColor.Color = Color.White;
            yAxis.MajorGridlines.Format.Fill.ForeColor.Color = Color.White;

            // This method allows to set specific properties for the axis lines,
            // Including aligning the lines within the chart area.
            xAxis.NegativeCustomProperty = "Inside";
            yAxis.NegativeCustomProperty = "Inside";

            // Save the modified document
            doc.Save("CustomizedChart.docx");

            Console.WriteLine("Chart customized and saved successfully.");
        }
    }
}
Load the Word Document: The document is loaded with the path "SampleDocument.docx".
Access the Chart: We access the chart by locating it as a child node in the document.
Get Axis Objects: We access the horizontal (xAxis) and vertical (yAxis) axes from the Axes collection.
Shift Axis Lines: The .MajorGridlines.Format.Fill.ForeColor.Color property is used to customize the gridline colors. The NegativeCustomProperty property is a hypothetical representation and should be replaced with actual axis properties available in Aspose for specific alignment needs.
Save the Document: After customizing the chart, the document is saved with the path "CustomizedChart.docx".
NegativeCustomProperty is just for demonstration. You should replace this with the actual properties that allow axis alignment inside.By following the instructions above, you can customize the chart in Word documents using Aspose.Words for .NET.
I want this for line chart.
Also i want to add some vertical lines on chart.
Please help on this too.
Thanks for your quick support.
Please help me on this, I want to impliment same feature.
As I mentioned in chart I want Y axis line inside chart only same as x Axis line, Please help me on this. We are facing issue in plotting.
@Amol_Hekade To edit X and Y values you can use
to get and edit values if they are negative.
To add additional lines to the chart you need to add Secondary Axis line
Please provide sample code to show that x and y axis lines crossing each other on 0
@Amol_Hekade Please provide the document with the chart you show in the first image. Is it created in MS Word? If you need to create a similar document, we may not be able to support it.
@Amol_Hekade Here is the code of something similar:
Document doc = new Document();
DocumentBuilder builder = new DocumentBuilder(doc);

Shape shape = builder.InsertChart(ChartType.Scatter, 432, 252);

Chart chart = shape.Chart;
ChartSeriesCollection seriesColl = chart.Series;

// Delete default generated series.
seriesColl.Clear();

// Adding new series.
ChartSeries series1 = seriesColl.Add("AW Series 1", new double[] { -0.7, -1.8, -2.6, 0.7, 1.8, 2.6 },
    new double[] { -0.7, -1.8, -2.6, 0.7, 1.8, 2.6 });
ChartSeries series2 = seriesColl.Add("AW Series 2", new double[] { -0.5, -1.5, -2.5, 0.5, 1.5, 2.5 },
    new double[] { -0.7, -1.8, -2.6, 0.7, 1.8, 2.6 });

// Make lines visible and set their colors.
series1.Format.Stroke.ForeColor = Color.Blue;
series1.Format.Stroke.Weight = 4;
series1.Marker.Format.Fill.ForeColor = Color.Blue;
series1.Marker.Format.Stroke.ForeColor = Color.Blue;
series1.Marker.Size = 6;
series2.Format.Stroke.ForeColor = Color.Green;
series2.Format.Stroke.Weight = 4;
series2.Marker.Format.Fill.ForeColor = Color.Green;
series2.Marker.Format.Stroke.ForeColor = Color.Green;
series2.Marker.Size = 6;

doc.Save("ScatterChartLineColorAndWeight.docx");
ChartWithCenteredYAxis.docx (15.3 KB)
PFA file , I want X and Y axis crosses at 0 if there is negative datapoint on series.
How to do this dynamically please share the logic.
@Amol_Hekade There is no universal solution, but you can use:
Document doc = new Document();
DocumentBuilder builder = new DocumentBuilder(doc);

Shape shape = builder.InsertChart(ChartType.Scatter, 432, 252);

Chart chart = shape.Chart;
ChartSeriesCollection seriesColl = chart.Series;
chart.Format.Stroke.Visible = false;
chart.AxisX.HasMajorGridlines = false;
chart.AxisY.HasMajorGridlines = false;

// Delete default generated series.
seriesColl.Clear();

double[] valuesX = { -6.0, -5.0, -3.0, 5.0, 10.0 };
double[] valuesY = { -5.0, -3.0, 6.0, 3.0, 5.0 };

int insertPosition = FindZeroInsertPosition(valuesX);

if (insertPosition != -1)
{
    valuesX = InsertZero(valuesX, insertPosition);
    valuesY = InsertZero(valuesY, insertPosition);
}

// Adding new series.
ChartSeries series1 = seriesColl.Add("AW Series 1", valuesX,
    valuesY);

// Make lines visible and set their colors.
series1.Format.Stroke.ForeColor = Color.Blue;
series1.Format.Stroke.Weight = 1;
series1.Marker.Format.Fill.ForeColor = Color.Blue;
series1.Marker.Format.Stroke.ForeColor = Color.Blue;
series1.Marker.Size = 6;
series1.Marker.Symbol = MarkerSymbol.Square;

doc.Save("output.docx");

public static int FindZeroInsertPosition(double[] array)
{
    for (int i = 0; i < array.Length - 1; i++)
    {
        if (array[i] < 0 && array[i + 1] > 0)
        {
            return i + 1;
        }
    }
    return -1;
}

public static double[] InsertZero(double[] original, int position)
{
    double[] newArray = new double[original.Length + 1];
    Array.Copy(original, 0, newArray, 0, position);
    newArray[position] = 0.0;
    Array.Copy(original, position, newArray, position + 1, original.Length - position);
    return newArray;
}