Hello Aspose Support,
I’m experiencing an issue with chart data labels in Aspose.Words for .NET. While it’s technically possible to set a custom FormatCode for ChartDataLabels, it appears to have no effect on the final output in Word.
After some investigation, I found that the issue is likely caused by the underlying data cells behind the chart not being formatted properly (e.g., as percent or currency). Word seems to ignore the FormatCode on the label itself unless the associated data cell is already formatted accordingly.
However, in Aspose.Words, this underlying data structure (the chart’s internal data grid) is not accessible for formatting. It can only be filled with double values via the ChartSeries.Values collection. There is no API to define the cell format type (e.g., percent, number, text), which is necessary for Word to interpret the label format correctly.
As a result, we are unable to display values like 0.5 as "50%" in data labels, even when explicitly setting DataLabels.NumberFormat.FormatCode = "0%".
Could you confirm whether this is a known limitation or a bug? Is there any planned support to expose the data grid or provide formatting capabilities at the cell level?
Thanks in advance and best regards!
Andrei
@awestphal
Could you please clarify if you are using the latest version of Aspose.Words for .NET and provide a sample code snippet demonstrating how you are setting the FormatCode for ChartDataLabels?
@awestphal Could you please attach your problematic input, output and expected output documents along with code that will allow us to reproduce the problem on our side? We will check the issue and provide you more information.
I use version 25.4.0
I create a bar chart inside a word document from scratch.
I tried all variants of percentages:
seriesMen.DataLabels.NumberFormat.FormatCode = "0%";

seriesMen.DataLabels.NumberFormat.FormatCode = "0'%'";

seriesMen.DataLabels.NumberFormat.FormatCode = "0\"%\"";
There are a lot of formatting option documented - the only one that ist working is the coloring:
seriesMen.DataLabels.NumberFormat.FormatCode = "[Red]0%"; // -> Prints the text in Red but with no percentage sign.
It’s no difference if the data value is set to 100.0 or 100 or 1.0 or 1 (for 100%).
For the axis the formatting is working:
chart.AxisY.NumberFormat.FormatCode = "0'%'";
but Data Label formatting is different because it depends on the format of the cells in the underlying data grid that is not accessible in Apose.Words.
I think the issue is well-known and widely discussed.
You can simply try it out in Microsoft Word also - formatting of Data Labels does not work until you edit the underlying data and format the data cells.
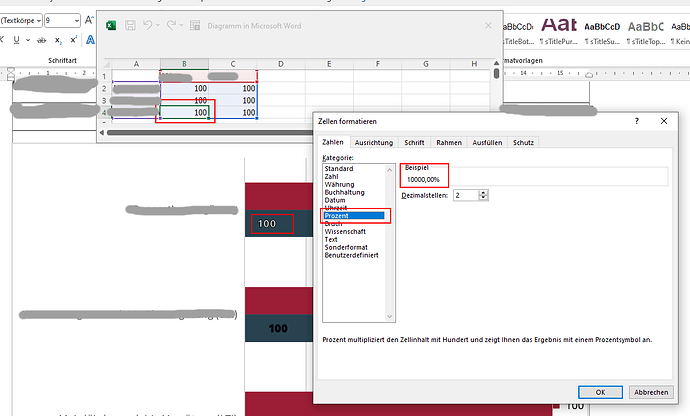
Image1: setting of percentage in label display options does not work
Image2: need to format cell data to percentage (Sample value is false - has to be 1 for 100%)
Image3: percentage sign is printed correct if data ist formated as percentage

I need a bit time for this because this is all confidential.
You can just try to produce an bar chart inside a word document where the bars have labels that include percentage signs like in this sample:

I’ll try to create a sample project for you…
@awestphal Thank you for additional information, but could you please provide a simple runnable code that will allow us to reproduce the problem? Also, please provide you current and expected output document in DOCX format. Unfortunately, screenshots are not very useful for analysis.
empty.docx (13.1 KB)
Hello Alexy,
I have some code for you now. I send you two different word files that are uses as sample templates. File empty.docx gave me empty_chart.docx as output (with no percent signs with same code) and empty3.docx gave me empty3_chart.docx with correct displayed data labels).
I could not upload upload empty3.docx because it has zero bytes - just create an empty docx by yourself.
Maybe that’s the root of the problem? Data labeling works only correct in an totally empty word document and not if you insert a chart into an existing document?
empty3_chart.docx (8.6 KB)
empty_chart.docx (11.9 KB)
empty.docx (13.1 KB)
Please replace the documentContent in the code by the one or other template file.
public async Task<Result<byte[]>> CreateSampleChartAsync(CancellationToken cancellationToken)
{
    SetAsposeWordsLicense();

    byte[] documentContent = Resource.empty3;

    if (documentContent == null)
    {
        return Result.Failure<byte[]>("No template");
    }

    using MemoryStream ms = new();
    ms.Write(documentContent, 0, documentContent.Length);
    ms.Position = 0;
    Document wordDoc = new(ms);
    DocumentBuilder builder = new(wordDoc);

    Shape shape = builder.InsertChart(ChartType.Bar, 446, 300);
    Chart chart = shape.Chart;
    chart.Title.Show = false;

    string[] categories = ["Category 1", "Category 2"];

    double[] menValues = [0.2, 1.0];
    double[] womenValues = [0.6, 0.5];

    chart.Series.Clear();
    ChartSeries seriesMen = chart.Series.Add("men", categories, menValues);
    ChartSeries seriesWomen = chart.Series.Add("women", categories, womenValues);

    seriesMen.Format.Fill.ForeColor = System.Drawing.Color.FromArgb(40, 67, 79);
    seriesWomen.Format.Fill.ForeColor = System.Drawing.Color.FromArgb(156, 30, 54);

    chart.AxisX.AxisBetweenCategories = true;
    chart.AxisX.Hidden = false;
    chart.AxisX.TickLabels.Position = AxisTickLabelPosition.Low;
    chart.AxisX.TickLabels.Offset = 0;
    chart.AxisX.Scaling.Type = AxisScaleType.Linear;

    chart.AxisY.HasMajorGridlines = true;
    chart.AxisY.MajorUnit = 0.2;
    chart.AxisY.NumberFormat.FormatCode = "0%";
    chart.Legend.Position = LegendPosition.Bottom;

    seriesMen.HasDataLabels = true;
    seriesMen.DataLabels.ShowValue = true;
    seriesMen.DataLabels.ShowCategoryName = false;
    seriesMen.DataLabels.ShowSeriesName = false;
    seriesMen.DataLabels.NumberFormat.IsLinkedToSource = false;
    seriesMen.DataLabels.NumberFormat.FormatCode = "0%";
    seriesMen.DataLabels.Font.Size = 9;
    seriesMen.DataLabels.Position = ChartDataLabelPosition.InsideBase;

    seriesWomen.HasDataLabels = true;
    seriesWomen.DataLabels.ShowValue = true;
    seriesWomen.DataLabels.ShowCategoryName = false;
    seriesWomen.DataLabels.ShowSeriesName = false;
    seriesWomen.DataLabels.NumberFormat.IsLinkedToSource = false;
    seriesWomen.DataLabels.NumberFormat.FormatCode = "0%";
    seriesWomen.DataLabels.Font.Size = 9;
    seriesMen.DataLabels.Position = ChartDataLabelPosition.InsideBase;

    chart.AxisY.Scaling.Minimum = new AxisBound(0);
    chart.AxisY.Scaling.Maximum = new AxisBound(1);

    // set document creation timestamp
    wordDoc.BuiltInDocumentProperties.CreatedTime = DateTime.Now;
    wordDoc.UpdatePageLayout();
    wordDoc.UpdateFields();

    ms.SetLength(0);
    wordDoc.Save(ms, SaveFormat.Docx);
    return Result.Success(ms.ToArray());
}
Thank you and regards
Andrei
@awestphal Thank you for additional information. Please try setting the following property:
seriesMen.DataLabels.ShowPercentage = false;
Thank you very much! It works with this setting. However, it’s quite confusing to have to set showPercentage = false, which actually means the opposite of what you want — but only applies to pie charts, and therefore has the opposite effect for all other chart types. It’s impossible to figure this out from the documentation which says:
“Allows to specify whether percentage value is to be displayed for the data labels of the entire series. Default value is false. Applies only to Pie charts.”
Default value false seems also not to work…
Maybe you can clarify the docs a bit 
Thanks and best regards
Andrei
@awestphal You are right this is not obvious. The DataLabels.ShowPercentage property enables or disables showPercent (Show Percent) attribute. The specification says the following:
21.2.2.187 showPercent (Show Percent)
This element specifies that the percentage shall be shown in a data label.
Why MS Word behaves such way is not clear.