Different Label and Value for Charts

Chart Label

Value Assign

Template
template.docx (29.0 KB)

May I know is any method to display the label differently with the value assign in the table?

Example
Let say A object, the background color value is 50 and how can I display the label 8?

Please advise how can I display it, or any other approach to use.

public class Data {
     public List<PieChartList> pieChartList {get;set;}
}

public class PieChartList{
     public string Name {get;set;}
     public int Value {get;set;}
}

 List<PieChartList> pieChartList = new List<PieChartList>
 {
      // First PieChartList (original scores)
     new PieChartList
     {
         A = new Pies { Name = "A", Value = 50 },
         B = new Pies { Name = "B", Value = 30 },
         C = new Pies { Name = "C", Value = 40 },
         D = new Pies { Name = "D", Value = 80 },
     },
     // Second PieChartList (inverse scores)
     new PieChartList
     {
       
         A = new Pies { Name = "A", Value = 50 },
         B = new Pies { Name = "B", Value = 70 },
         C = new Pies { Name = "C", Value = 60 },
         D = new Pies { Name = "D", Value = 20 },
     },
     // Third PieChartList (zero-filled)
     new PieChartList
     {
         A = new Pies { Name = "A", Value = 0 },
         B = new Pies { Name = "B", Value = 0 },
         C = new Pies { Name = "C", Value = 0 },
         D = new Pies { Name = "D", Value = 0 },
     },
     // Fourth PieChartList (zero-filled)
     new PieChartList
     {
         A = new Pies { Name = "A", Value = 0 },
         B = new Pies { Name = "B", Value = 0 },
         C = new Pies { Name = "C", Value = 0 },
         D = new Pies { Name = "D", Value = 0 },
     }
 };

Data data  = new Data();
data.pieChartList = pieChartList;

var documentPath = "template.docx";
Document document = new Document(documentPath);
ReportingEngine engine = new ReportingEngine();
engine.Options = ReportBuildOptions.AllowMissingMembers;
engine.BuildReport(document, data);
document.Save("output.pdf");

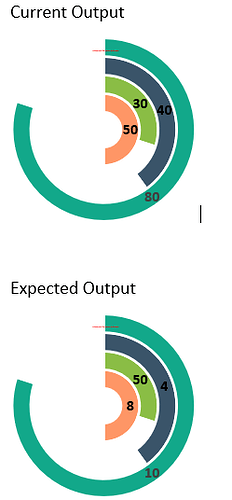
@leoteoh If possible, could you please provide your current and expected outputs? This will help us better understand your requirements.

Hi alexey.noskov, the first chart that I attached is the expected output.

My current situation right now, let’s check the inner orange pie. If I assigned the value to 50, the progress color and label will be showing 50. But the expected output is the progress color to be 50 and the label to be 8.

I have attached the input file again, after you run the code, it will generate the result.
template.docx (29.0 KB)

Have uploaded the result

@leoteoh

Unfortunately, there is no way to show a label with a different value because of MS Word limitations. However, you can change values themselves to match expected labels. Here is how.

For example, to have label “8”, the only way is to have “original score” equal to 8. Please note that for donut and pie charts only a ratio of its pieces is important. So, to have the ratio 50/50 of “original score” to “inverse score”, “inverse score” should also be changed to 8. Thus, you will get a half of a donut labeled as “8”. The same approach should be applied to other values to get expected output.

Alright noted, I will try this method.

1 Like

Hi,

I try to select custom excel column to display the value 8, but it seems like chart doesn’t refresh and get the correct value.

@leoteoh Probably you can simply use a simple textbox instead of actual data label to show the required value.