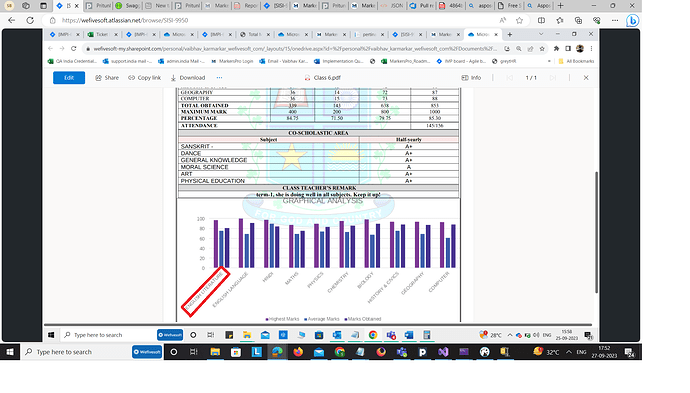
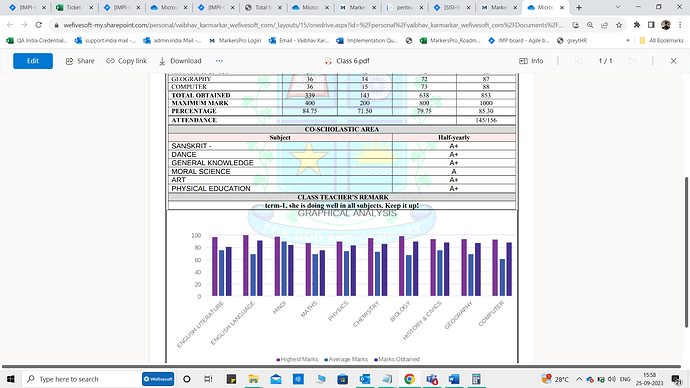
How to wrap label of x-axis of a chart means how bring label of x-axis in two line if it contains large string. Image attached
You can use Environment.NewLine or ‘\n’ character to break the line. However, can you please share how you are adding it in the PDF in the first place? We will further our feedback with you.
if (_reportcardchart != null && reportCardFormatAssociationModel.ParameterDetails.IsShowGraph && (_reportcardchart.ListOfHightestMarks.Any() || _reportcardchart.ListOfAverageMarks.Any() || _reportcardchart.ListOfHightestMarks.Any()))
{
    license.SetLicense(@"Aspose.Words.NET.lic");
    Aspose.Words.Document doc1 = new Aspose.Words.Document(workingDocument);
    Aspose.Words.Tables.Table graphtable = doc1.GetChildNodes(NodeType.Table, true).Cast<Aspose.Words.Tables.Table>().ToList().Where(e => e.Title == "GraphSection").FirstOrDefault();
    if (graphtable != null)
    {
        DocumentBuilder builder = new DocumentBuilder(doc1);
        builder.MoveTo(graphtable);
        Shape shape = builder.InsertChart(ChartType.Column, 550, 252);
        Aspose.Words.Drawing.Charts.Chart chart = shape.Chart;
        chart.Series.Clear();
        chart.Title.Show = false;
        ChartAxis yAxis = chart.AxisY;
        yAxis.Scaling.Minimum = new AxisBound(0);
        yAxis.Scaling.Maximum = new AxisBound(110);
        string[] categories = new string[] { "Highest Marks", "Average Marks", "Marks Obtained" };

        shape.StrokeColor = System.Drawing.Color.White;
        shape.FillColor = System.Drawing.Color.White;
        shape.Fill.Opacity = 0.3;
        if (reportCardFormatAssociationModel.ParameterDetails.IsHighestMarks && _reportcardchart.ListOfHightestMarks != null && _reportcardchart.ListOfHightestMarks.Count > 0)
        {
            ChartSeries series = chart.Series.Add("Highest Marks", _reportcardchart.ListOfHightestMarks.Select(e => e.SubjectTitle).ToArray(), _reportcardchart.ListOfHightestMarks.Select(e => e.points).ToArray());
            if (reportCardFormatAssociationModel.ParameterDetails.BarColor.Mode.ToLower() != "auto")
                series.Format.Fill.ForeColor = CC.FromHtml(reportCardFormatAssociationModel.ParameterDetails.BarColor.Colors.Split(',')[0]);
        }

        if (reportCardFormatAssociationModel.ParameterDetails.IsAverageMarks && _reportcardchart.ListOfAverageMarks != null && _reportcardchart.ListOfAverageMarks.Count > 0)
        {
            ChartSeries series = chart.Series.Add("Average Marks", _reportcardchart.ListOfAverageMarks.Select(e => e.SubjectTitle).ToArray(), _reportcardchart.ListOfAverageMarks.Select(e => e.points).ToArray());
            if (reportCardFormatAssociationModel.ParameterDetails.BarColor.Mode.ToLower() != "auto")
                series.Format.Fill.ForeColor = CC.FromHtml(reportCardFormatAssociationModel.ParameterDetails.BarColor.Colors.Split(',')[2]);
        }

        if (reportCardFormatAssociationModel.ParameterDetails.IsObtainedMarks && _reportcardchart.ListOfObtainedMarks != null && _reportcardchart.ListOfObtainedMarks.Count > 0)
        {
            ChartSeries series = chart.Series.Add("Marks Obtained", _reportcardchart.ListOfObtainedMarks.Select(e => e.SubjectTitle).ToArray(), _reportcardchart.ListOfObtainedMarks.Select(e => e.points).ToArray());
            if (reportCardFormatAssociationModel.ParameterDetails.BarColor.Mode.ToLower() != "auto")
                series.Format.Fill.ForeColor = CC.FromHtml(reportCardFormatAssociationModel.ParameterDetails.BarColor.Colors.Split(',')[1]);
        }
    }
    doc1.Save(workingDocument, SaveFormat.Doc);
}
else
{
    Aspose.Words.Document doc1 = new Aspose.Words.Document(workingDocument);
    Aspose.Words.Tables.Table graphtable = doc1.GetChildNodes(NodeType.Table, true).Cast<Aspose.Words.Tables.Table>().ToList().Where(e => e.Title == "GraphSection").FirstOrDefault();
    if (graphtable != null)
        graphtable.Remove();
}
This logic we are using but for if we have less subject that time subject title of X-axis working fine. but we if we have many subjects and subject title is greater that time this was not wrap. attaching screen shot for reference.
Looks like you are using Aspose.Words. Therefore, we have moved this inquiry to respective forum category where you will be assisted accordingly.
@wefivesoft You can use "\r\n" in category name to insert line break. For example see the following code:
Document doc = new Document();
DocumentBuilder builder = new DocumentBuilder(doc);

Shape shape = builder.InsertChart(ChartType.Column, 432, 252);
Chart chart = shape.Chart;
ChartSeriesCollection seriesColl = chart.Series;
seriesColl.Clear();
string[] categories = new string[] { "Aspose.Words Long\r\nCategory 1 Name", "Aspose.Words Long\r\nCategory 2 Name" };

// Adding new series. Please note, data arrays must not be empty and arrays must be the same size.
seriesColl.Add("AW Series 1", categories, new double[] { 1, 2 });
seriesColl.Add("AW Series 2", categories, new double[] { 3, 4 });
seriesColl.Add("AW Series 3", categories, new double[] { 5, 6 });
seriesColl.Add("AW Series 4", categories, new double[] { 7, 8 });
seriesColl.Add("AW Series 5", categories, new double[] { 9, 10 });

doc.Save(@"C:\Temp\out.docx");

