Hi Team,
When we are trying to use [LINQ Reporting Engine] to bind the json data with the chart in our words template, we found that chart display area has the limit. We have more than 300 series y[value] in our json file, but the chart only could display first 100s.
Do we have anyway to auto generate the chart setting to make sure it contains all the data?

For example, this is our chart screenshot.
Please share any ideas if you have.
Thank you,
Yiyang
@YiyangShi Could you please attach your template and sample data here for testing? We will check the issue and provide you more information.
Hi Alexey,
Here is our sample template and json file.
areaChartSample.zip (33.1 KB)
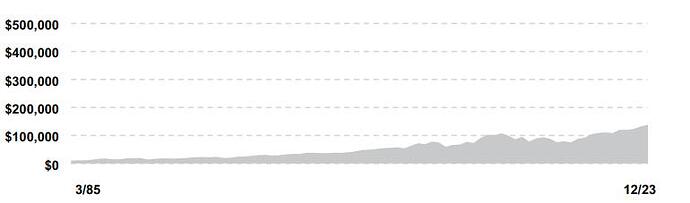
What we got from this template and json file is:
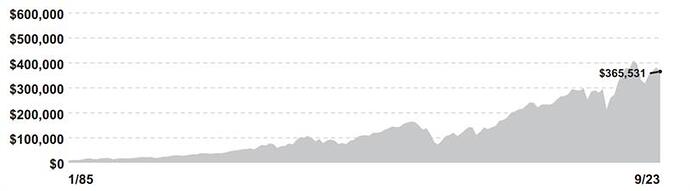
But what we are expecting is:
As you can see, there are a lot of the data not showing in the chart.

Above is how we use the LINQ Reporting Engine.
Please advise.
Thank you.
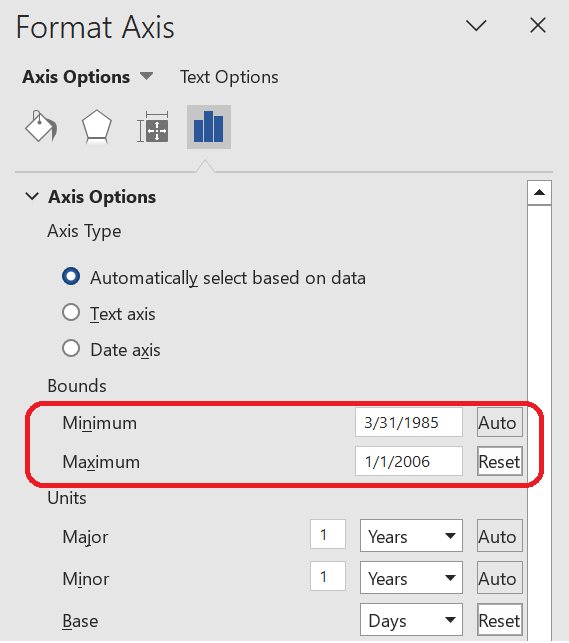
@iampranoti @YiyangShi The problem occurs because the maximum bunds for horizontal axis is explicitly set in your template:
Reset this value and the result will be correct. Please see the updated template and output produced by the following code:
JsonDataSource ds = new JsonDataSource("C:\\Temp\\data.json");

Document doc = new Document("C:\\Temp\\in.docx");
ReportingEngine engine = new ReportingEngine();
engine.setOptions(ReportBuildOptions.ALLOW_MISSING_MEMBERS);
engine.buildReport(doc, ds, "areaCharts");
doc.save("C:\\Temp\\out.docx");
data.zip (1.6 KB)
in.docx (37.4 KB)
out.docx (29.8 KB)