LINQ Reporting Engine - Gauge Chart, Secondary Axis in Chart

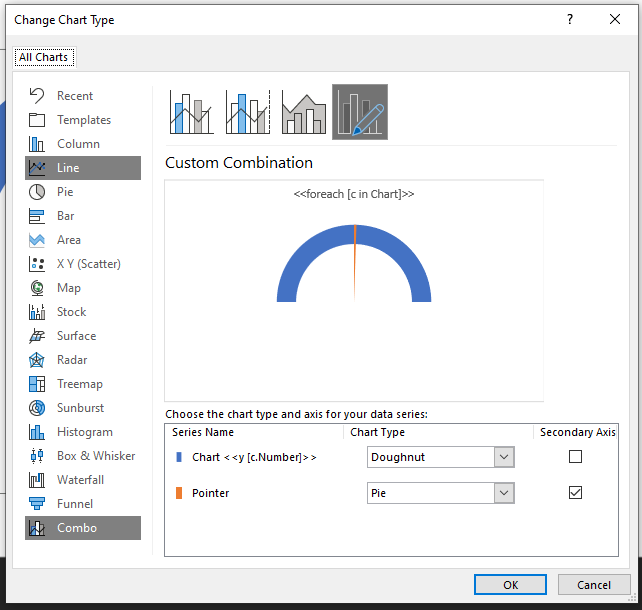
I was attempting to make a Gauge Chart with Linq Reporting Engine. Unfortunately, there is no simple chart; instead, a combination of Doughnut Chart and Pie Chart must be used. For the time being, I’m having trouble displaying the pie chart which is the Pointer Variable as a secondary axis.

C# Code

Using Aspose.Words;
Using Aspose.Words.Reporting;
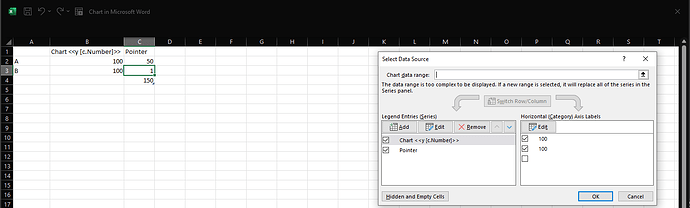
Chart = [
        { Name = "A", Number = 100},
        { Name = "B", Number = 200}
    ]

Pointer = [
        { Name = "Value", Number = 50},
        { Name = "Pointer", Number = 1},
        { Name = "Total", Number = 201 - (50 + 1)},
    ]

Sender sender = new Sender { Chart = Chart, Pointer = Pointer }

string inputFile = @"<<Path>>/Doc1.docx";
Document doc = new Document(inputFile);
ReportingEngine engine = new ReportingEngine();
engine.Options = ReportingBuildOptions.AllowMissingMembers;
engine.BuildReport(doc, sender);

outputFile = @"<<Path>>";
doc.Save(outputFile)

Attachment


document.docx

References
Here is the references video: https://www.youtube.com/watch?v=f6c93-fQlCs

@leoteoh I have logged a task WORDSNET-25951 in our defect tracking system. We will investigate possibility of creating such chart using LINQ Reporting Engine and provide you more information once analysis is done.

@leoteoh

It is possible to build a chart as required, but input data should be changed as shown in the following code snippet:

string json = @"
{
    data:
    [
        { title: ""A"", back: 100, pointer: 30},
        { title: ""B"", back: 100, pointer: 1},
        { title: ""C"", pointer: 169},
    ]
}";

MemoryStream stream = new MemoryStream(Encoding.UTF8.GetBytes(json));
JsonDataSource dataSource = new JsonDataSource(stream);

Document document = new Document("Doc1_Modified.docx");

ReportingEngine engine = new ReportingEngine();
engine.BuildReport(document, dataSource, "data");

document.Save("Doc1_Modified Out.docx");

Here is the modified template used by the snippet: Doc1_Modified.docx (25.6 KB).