Hello,
I’m using Aspose.Words with the LINQ Reporting Engine and I’m trying to create a scatter chart with two series (temperature and conductivity), both using a common date as the X-axis.
Here’s what I’ve implemented:
- In the chart title:
<<foreach [sample in combined]>>
- In the chart Alt Text / Description:
xml
CopierModifier
<<foreach [sample in combined]>>
  Temperature
  <<x [sample.Date.ToOADate()]>>
  <<y [sample.Temperature]>>

  Conductivity
  <<x [sample.Date.ToOADate()]>>
  <<y [sample.Conductivity]>>
<</foreach>>
- Series names in the chart are exactly:
Temperature and Conductivity
- Data sheet behind the chart is either empty or filled with
=1 placeholders
- The
combined variable is a list of objects defined earlier in the template.
Problem
When generating the document, I either get:
- A chart with only one point shown
- Or this error:
“A template for chart ‘<<foreach [sample in combined]>>’ is not well-formed. Found no series with values calculated from expressions.”
Question
Is it possible to render multiple series in a scatter chart using LINQ Reporting Engine?
If yes, could you please share a working example or clarify the exact structure required for the template?
Thanks a lot in advance and sorry for the bother,
Best regards,
Axelle
@Axelle_M
Could you please provide more details about the structure of the ‘combined’ variable and how it is defined in your template?
Certainly, here are the details regarding the combined variable:
In the template, I start by retrieving and averaging raw data samples from two time series: TemperatureTimeSerie and ConductivityTimeSerie. I then group them by day and combine them into a unified list. Here’s the exact definition in the template:
<<var [ValidConductivitySamples = Query.GetDataSamples(well, "ConductivityTimeSerie").Where(s => s.Value.HasValue && s.Value != 0)]>>
<<var [ValidTemperatureSamples = Query.GetDataSamples(well, "TemperatureTimeSerie").Where(s => s.Value.HasValue && s.Value != 0)]>>

<<var [OrderedConductivity = ValidConductivitySamples.OrderBy(s => s.Time)]>>
<<var [GroupedCond = OrderedConductivity.GroupBy(s => s.Time.Date)]>>
<<var [dailyCond = GroupedCond.Select(g => new { Date = g.Key, Conductivity = g.Average(s => s.Value.Value) })]>>

<<var [OrderedTemp = ValidTemperatureSamples.OrderBy(s => s.Time)]>>
<<var [GroupedTemp = OrderedTemp.GroupBy(s => s.Time.Date)]>>
<<var [dailyTemp = GroupedTemp.Select(g => new { Date = g.Key, Temperature = g.Average(s => s.Value.Value) })]>>

<<var [allDates = dailyCond.Select(x => x.Date).Concat(dailyTemp.Select(x => x.Date)).Distinct().OrderBy(d => d)]>>

<<var [combined = allDates.Select(date => new {
    Date = date,
    Conductivity = dailyCond.Where(x => x.Date == date).Select(x => x.Conductivity).FirstOrDefault(),
    Temperature = dailyTemp.Where(x => x.Date == date).Select(x => x.Temperature).FirstOrDefault()
})]>>
@Axelle_M
Here is a working example of a scatter chart being built using LINQ Reporting Engine. Although it consists of one series, a template for a scatter chart with two series is quite similar and this is a supported scenario.
Unfortunately, the provided details are not enough for telling what is wrong in this case. The provided error message is not typical and probably indicates that series were not correctly added to the chart template using MS Word. To check this guess, please make sure that the both concerned series are displayed in the template before building a report and let us know an outcome.
Hello,
Apologies if my previous message wasn’t very clear. I’m attaching the document along with some screenshots to better illustrate what I’ve been working on.
C4.docx (29,8 Ko)
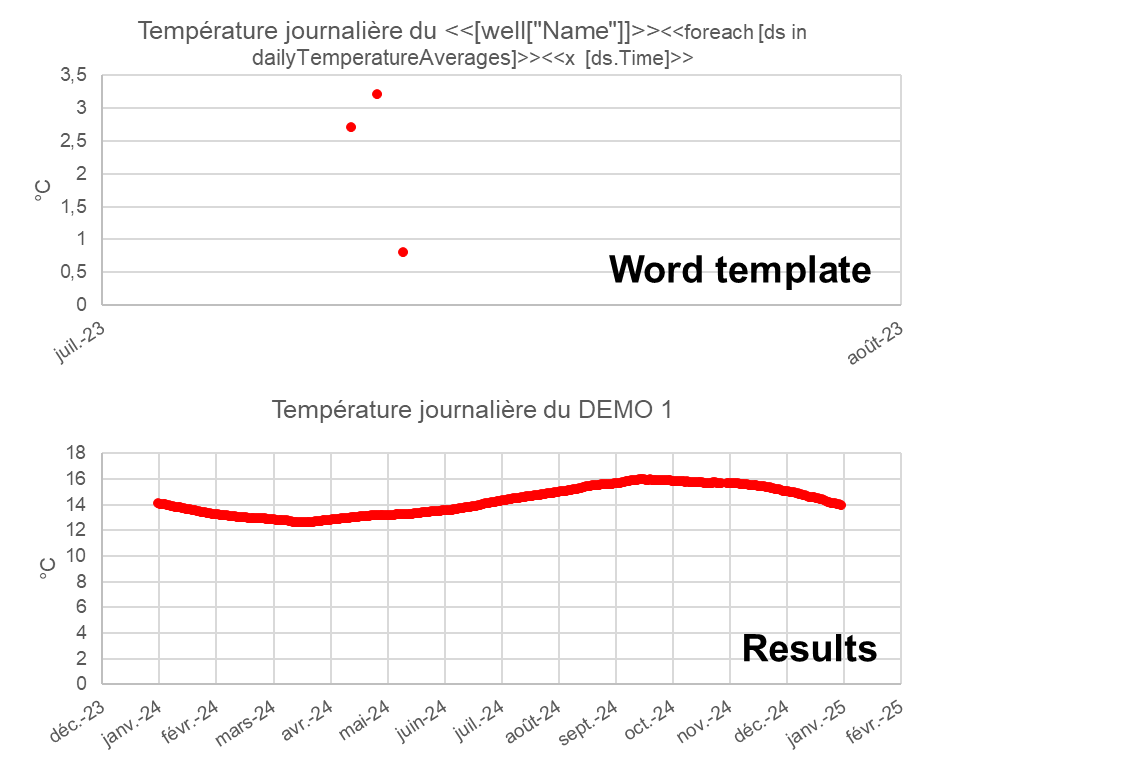
I was able to successfully display a single dataset on a scatter plot (chart below).
However, when I try to include two datasets, using foreach in the chart title no longer works. I suspect I may be placing the calls incorrectly within the scatter chart setup or using the wrong syntax.
For context, I tried to structure the data so that each date includes two values, like this:
Date – Conductivity – Temperature
01/01/2010 – 1200µS/cm – 21°C
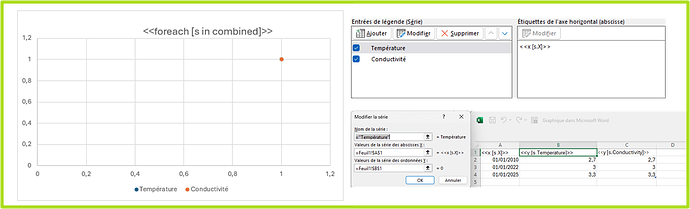
In my attempt to plot both values on the same chart, I used the structure shown in the chart and the screenshots highlighted in green below
This results in the following error message:
“A template for chart ‘<<foreach [sample in combined]>>’ is not well-formed. Found no series with values calculated from expressions.”
I must admit I’m a bit lost at this point, and I truly appreciate your help and support.
Best regards,
Axelle
@Axelle_M Thank you for additional information. We will check the issue and get back to you soon.
@Axelle_M Please try using the following template: in.docx (30.7 KB)
Here is code used for testing:
var doc = new Document(@"C:\Temp\in.docx");

var dataSource = new DataItem[]
{
    new DataItem { Date = new DateTime(2024, 1, 1), Temperature = 10, Conductivity = 7 },
    new DataItem { Date = new DateTime(2024, 2, 1), Temperature = 15, Conductivity = 5 },
    new DataItem { Date = new DateTime(2024, 3, 1), Temperature = 7, Conductivity = 9 },
    new DataItem { Date = new DateTime(2024, 4, 1), Temperature = 14, Conductivity = 11 }
};

var engine = new ReportingEngine();
engine.BuildReport(doc, dataSource, "combined");

doc.Save(@"C:\Temp\out.docx");
public class DataItem
{
    public DateTime Date { get; set; }

    public double X
    {
        get { return Date.ToOADate(); }
    }

    public double Temperature { get; set; }
    public double Conductivity { get; set; }
}
Here is the produced output: out.docx (14.6 KB)
I followed your example and reused the code — success, everything is working perfectly now! Thank you so much for your valuable help!
1 Like