Multiple issues with Aspose library

We are planning to get enterprise Aspose license for our PDF generation, but we are stuck with following issues while using Aspose API for our requirement. Can someone help us resolve them before we go for enterprise license?

  1. Aspose.PDF API does not support creating charts in PDF documents. Please refer below forum in which they clarifies this point.
    Creating Pie Chart, Bar Chart , Column Chart and Line Chart using Aspose.pdf - #2 by asad.ali

As a workaround, we are generating with required charts using Aspose Word api and converting it to PDF using Aspose Pdf api.

  1. Tried converting word to pdf. Below are the issues faced.
    • Font issue: When the font set from AsposeWord/PDF api, it is not reflecting in the document generated by Aspose.
    • Even when a pdf document is converted to a word document using Aspose pdf api. Original font from the source document(pdf) is not reflected in the converted document(word). If a font is not found in the machine, without any exception/message Aspose API applies some other fonts for conversion.
    • Font setting issue with word: Need to set font properties every time, throughout the document using DocumentBuilder object. Is there any way to set by grouping?
    • Document to pdf conversion results in broken/with different font types.
    Original Pdf document has below value :

After editing and saving pdf, it displays like below:

• Chart/graph alignment issue: With the documentation, alignment of chart/graph is not accurate when we do it in multiple section.

Above donut chart is generated using below values.

Only first series value is colored, and next available values are not visible in the pie chart. It is supposed to show variation by colors like below.

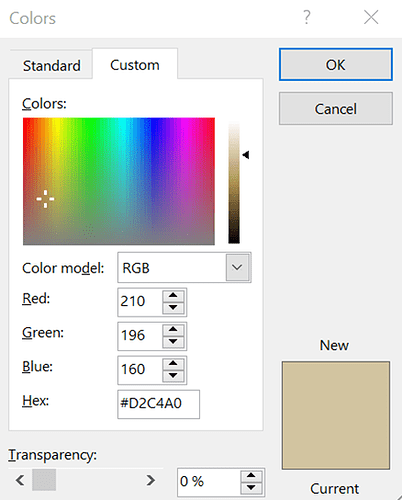
• Coloring issue, other than primary color. When its equivalent HSB value is used and it’s not accurate. In below code HSB value for RGB value (210,196,160) used but chart filled with different color.


It applies different color in the chart, like below.

• In the column chart, (chartseries) Y-axis accepts only string values. When negative value added, it’s not reflected in the chart that is generated, its stays in positive position not inverted.

Resultant chart in pdf:

@manishvyas

Could you please provide a simple code example and required document that will allow us to reproduce the problem. If you are generating document using Aspose.Words and then save the document to PDF, the fonts used in the input/generated document should be available in the environment where the document is converted to PDF. Otherwise Aspose.Words substitutes the missed fonts.

The issue seems to be related to Aspose.PDF since Aspose.Words for Java does not support loading PDF documents. Please attach your input PDF document for testing. @tahir.manzoor could you please take a look.

DocumentBuilder inherits the fonts set in the location where it’s cursor is moved. So once cursor is moved using DocumentBuilder.moveToXXX method and you need to use font that is different than set in the current location, you should set font properties in the DocumentBuilder.

Please attach your input and output document along with code that will allow us to reproduce the problem. I suspect that the problem occurs because your input document is PDF, which is converted to Word document using Aspose.PDF and then edited by Aspose.Words. You should note that PDF documents are fixed page documents (all elements on the page have absolute position), while Word documents are flow documents and it is extremally difficult and in most cases impossible to have 100% fidelity after conversion from fixed page model to flow document.

I have used the following code for testing:

Document doc = new Document();
DocumentBuilder builder = new DocumentBuilder(doc);

Shape chart = builder.insertChart(ChartType.DOUGHNUT, 300, 300);
chart.getChart().getSeries().clear();
ChartSeries series = chart.getChart().getSeries().add("test",
        new String[] { "Category 1", "Category 2", "Category 3", "Category 4" },
        new double[] { 98.87, 0.75, 0.21, 0.17 });

doc.save("C:\\Temp\\out.docx");
doc.save("C:\\Temp\\out.pdf");

Colors of slices are set properly, 3 slices in your chart are very thin and they have white borders, that overlaps the slices. You can set border width to to zero to work this around:

for(int i=0; i<series.getDataPoints().getCount(); i++)
    series.getDataPoints().get(i).getFormat().getStroke().setWeight(0);

In your code you specify shape color, but it looks like you need to set series color. To achieve this you should use ChartFormat.

Yes, X values (Categories) accept string values, this is like MS Word does. So this is an expected behavior. If you need to sort the values, you should do this before passing to series.