word里定位到一个可以编辑的图表,怎么把它变成图片并替换原先的图表
@liufei951027 您可以使用 ShapeRenderer 将图表渲染为图像。 例如,请参阅以下代码,该代码演示了用其图像表示替换图表形状的基本技术:
Document doc = new Document("C:\\Temp\\in.docx");

// Get shape that contains a chart.
Shape chartShape = (Shape)doc.getChild(NodeType.SHAPE, 0, true);

// Render the chart to image and save the result into a stream.
ByteOutputStream chartImageStream = new ByteOutputStream();
chartShape.getShapeRenderer().save(chartImageStream, new ImageSaveOptions(SaveFormat.PNG));

// Crete a shape with chart image and insert it after the chart shape.
Shape imageShape = new Shape(doc, ShapeType.IMAGE);
imageShape.getImageData().setImageBytes(chartImageStream.getBytes());
imageShape.setWidth(chartShape.getWidth());
imageShape.setHeight(chartShape.getHeight());
// There might be other shape properties that you need to set, like wrapping or absolute position.
// ...........

chartShape.getParentNode().insertAfter(imageShape, chartShape);
// Remove chart shape.
chartShape.remove();

doc.save("C:\\Temp\\out.docx");
如果有多个图表都想变成图片,该怎样写
@liufei951027 您可以使用以下代码:
Document doc = new Document("C:\\Temp\\in.docx");

// Loop through all shapes in the document.
for (Shape s : (Iterable<Shape>)doc.getChildNodes(NodeType.SHAPE, true))
{
    // process only top level shapes with charts
    if (s.isTopLevel() && s.hasChart())
    {
        // Convert chart shape to image.
        // ................
    }
}
变成图片后,原本对应位置的颜色乱了,怎么处理
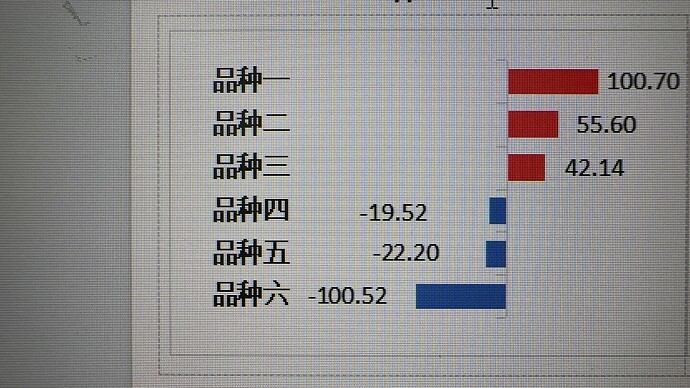
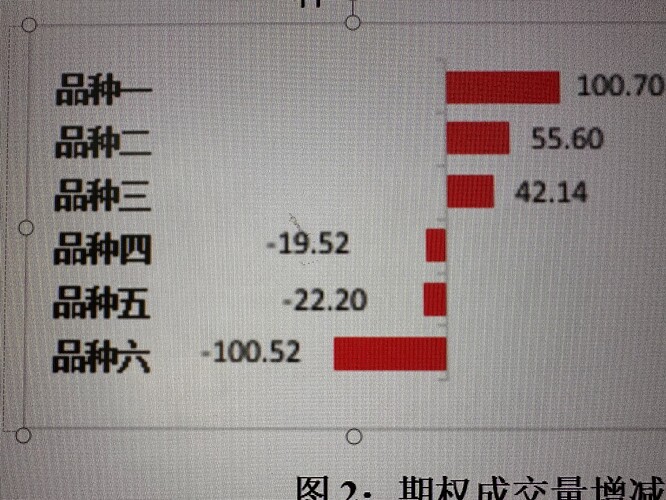
不好意思,我只能提供两个图片供您参考。 还存在一个问题就是带蓝色的可编辑图表,我已经通过java程序修改了数据,但是变成图片后还是最开始的值,已经测试过不变成图片就是编辑后的数据,而且我能保证处理成图片的逻辑是在处理数据之后。
@liufei951027 感谢您提供更多信息。 不幸的是,我无法使用最新的 24.2 版本的 Aspose.Words for Java 和以下代码重现该问题:
Document doc = new Document("C:\\Temp\\in.docx");

// Loop through all shapes in the document.
for (Shape s : (Iterable<Shape>)doc.getChildNodes(NodeType.SHAPE, true))
{
    // process only top level shapes with charts
    if (s.isTopLevel() && s.hasChart())
    {

        // Render the chart to image and save the result into a stream.
        ByteOutputStream chartImageStream = new ByteOutputStream();
        s.getShapeRenderer().save(chartImageStream, new ImageSaveOptions(SaveFormat.PNG));

        // Crete a shape with chart image and insert it after the chart shape.
        Shape imageShape = new Shape(doc, ShapeType.IMAGE);
        imageShape.getImageData().setImageBytes(chartImageStream.getBytes());
        imageShape.setWidth(s.getWidth());
        imageShape.setHeight(s.getHeight());
        // There might be other shape properties that you need to set, like wrapping or absolute position.
        // ...........

        s.getParentNode().insertAfter(imageShape, s);
        // Remove chart shape.
        s.remove();
    }
}

doc.save("C:\\Temp\\out.docx");
out.docx (35.7 KB)